The University of Reading is among the top 30 UK universities in the Times Higher Education World University Rankings 2020 and is home to 19,000 students from over 150 countries. In 2016 the University celebrated the 90th anniversary of its Royal Charter and over the decades they have become innovators and pioneers, pushing academic boundaries and leading social change.
The University of Reading has been a Tribal customer since 2000, supplying and supporting the University with its Student Information System. More recently, the University has been working alongside Tribal to develop a new Student Progress Dashboard.
The Student Progress Dashboard has been developed to encourage self-regulated learning by providing data to help students self-reflect on their performance, think about planning and change aspects of their assessment behaviours to support attainment.
Professor Emma Mayhew, PFHEA, Professor of Pedagogy in Politics and International Relations at The University of Reading explains:
“The team were very keen to provide more assessment data to academic tutors, and others involved in student support. We wanted to make assessment data easily accessible and timely, to help enhance staff-student conversations, especially around progress and the student’s own performance goals. These conversations can also encourage and support students to think more about the progress being illustrated by the Dashboard and to work towards improving or maintaining that attainment by actively identifying measures that could help, for example, increasing their engagement in feedback or seeking additional academic or pastoral support.”
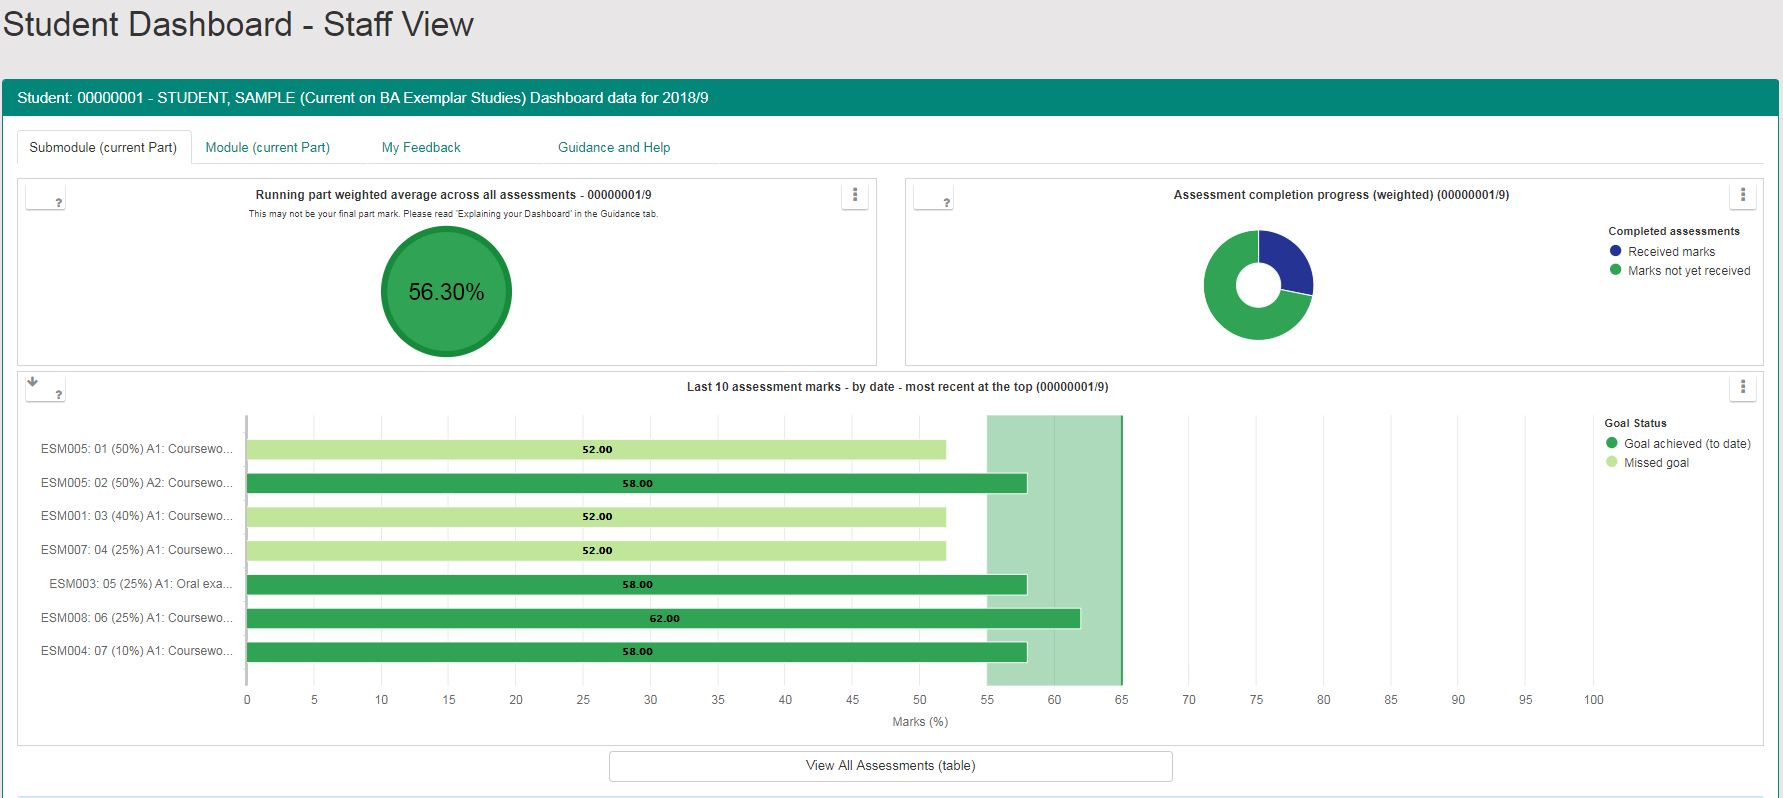
The Dashboard addresses these needs by leveraging business intelligence technology from Panintelligence to provide students with a clear visualisation of their data within their eVision portal. This allows the University of Reading to provide each student with an up-to-date graphical representation of their progress including:
- A running part weighted average across all assessments to indicate the overall mark, so far, in the current part.
- A pie chart showing how much assessment has been completed, on a weighted basis, so students can plan their time and understand the importance of higher weighted assessment.
- A series of bar charts showing performance within each module, across modules, and across the part. For a full part view, the Dashboard provides a table showing individual marks ordered according to type, weighting or module to compare performance across assessments or subject areas.
- An indication of student goals. Students can, optionally, outline a target mark range. The Dashboard data is colour-coded to reflect whether a student has exceeded, met or missed their goal. Students can set targets and share expectations with Tutors who can help students meet aims, manage or adjust expectations.
- A range of support materials to increase student understanding of how marks are calculated and develop strategies for improvement.
A solution for all
The Dashboard was made available to students in mid-November 2019. In 22 weeks, the Dashboard has recorded over 47,000 student record views (92 % of views were carried out by students and 8 % by staff).
Professor Emma Mayhew continues,
“We have been running a paper-based and online survey with our students since January 2020 and so far, 179 students have responded. We have received comments such as, ‘It is awesome’, ‘It's great because now I know where I stand and what I need to improve’, ‘I can see which module I’m doing well in and see which one requires more study and improvement’ and ‘the Dashboard makes me more aware of what areas I need to work on but also satisfying to know where I am excelling’.”
Darren Lloyd, Higher Education UK Sales Manager at Tribal Group explains,
“The University of Reading’s new Student Progress Dashboard has been launched successfully to students, with tremendous feedback. Encouraging students to self-reflect on their progress over time, and providing detailed performance data to academic tutors involved in student support, is increasingly important for retention and attainment and we hope to see many more institutions develop their Student Progress Dashboard in the near future.”
Professor Emma Mayhew concludes,
“This was a unique project. Considerable liaison was required to design, test and ensure that information was accurately displayed. Regular team meetings, effective communication, and strong project management enabled both University and Tribal to work very effectively together even during intense periods of highly complex development.”
For more information on how your institution could use a Student Progress Dashboard, get in touch.
TOPICS:

