An analysis of Teaching Financial Productivity in colleges
And how to move benchmarking beyond just a numbers game...
Benchmarking is not a new concept for colleges. Comparisons are commonly drawn between institutions as each college battles with its own unique set of challenges, as well as those common throughout the sector. The need to deliver a financially resilient organisation, whilst consistently delivering quality teaching and training, and meeting the needs of local employers and the wider community is not a simple formula.
So, when it comes to financial benchmarking, how deep do you go to bring about impact? Here we explore some benchmarking data that focuses on teaching productivity and illustrate what else is needed to inform impactful change.
What numbers are important?
There are several key performance indicators for colleges to aim for such as a Debt Service Cover Ratio, Cash Days in Hand, or an Adjusted Current Ratio[. Colleges are also encouraged to aim for a pay cost ratio equivalent to the total income of 65%*, (although in our experience that is a contentious measure). Even if we were satisfied that the payment to income measure was calculated fairly, it doesn’t help college leaders understand why a result is what it is, or indeed provide any indication as to where colleges should look to address an adverse outcome. It’s just a number.
*70% for Sixth Form Colleges
From working with colleges for over 25-years, we can offer several other evidence-based numbers from our benchmarking work such as 52%, 40%, and 8%. These numbers represent a Teaching Activity spend to core income ratio, a Non-Teaching Activity spend to core income ratio, and a Core Operational Margin. Again, without context, these are still just numbers, but at least begin to offer an indication of which areas of college activity are impacting the overall financial efficiency message.
Through benchmarking the college, we can begin to move away from the narrative driven by high-level numbers and show that although numbers and ratios are useful indicators, unless accompanied by further explanation and detail, they are just numbers.
What could be being missed?
Let’s focus on that 52%. How much of that is spent on Administrative Support activities such as placements, e-learning, curriculum design, coordination, or academic administration? What about Teaching Support activities such as academic technicians or additional learning support? That 52% figure could hide a huge underspend in these sorts of activities, which could be offsetting significantly greater normalised spending on Teaching and Training Delivery; and neither of these insights is remotely visible if colleges are just asked to focus on the 65% (pay cost ratio equivalent to total income) indicator. In the last eighteen months, we have asked several colleges, “What does your ALS offer look like? How effective is it?”, as spend on this activity was much lower than we would expect yet acted as a balancing measure that countered higher Teaching and Training Delivery costs.
Teaching Financial Productivity – the most significant measure
We find that colleges are either very interested in the cost of Teaching and Training Delivery or not at all. Either way, a Teaching Financial Productivity measure will always prompt discussion as it offers insight not available elsewhere.
Taking data from 2010, Teaching Financial Productivity averages at around £90,000 per Teaching and Training Delivery FTE. (There’s another number to add to your benchmarking checklist.)
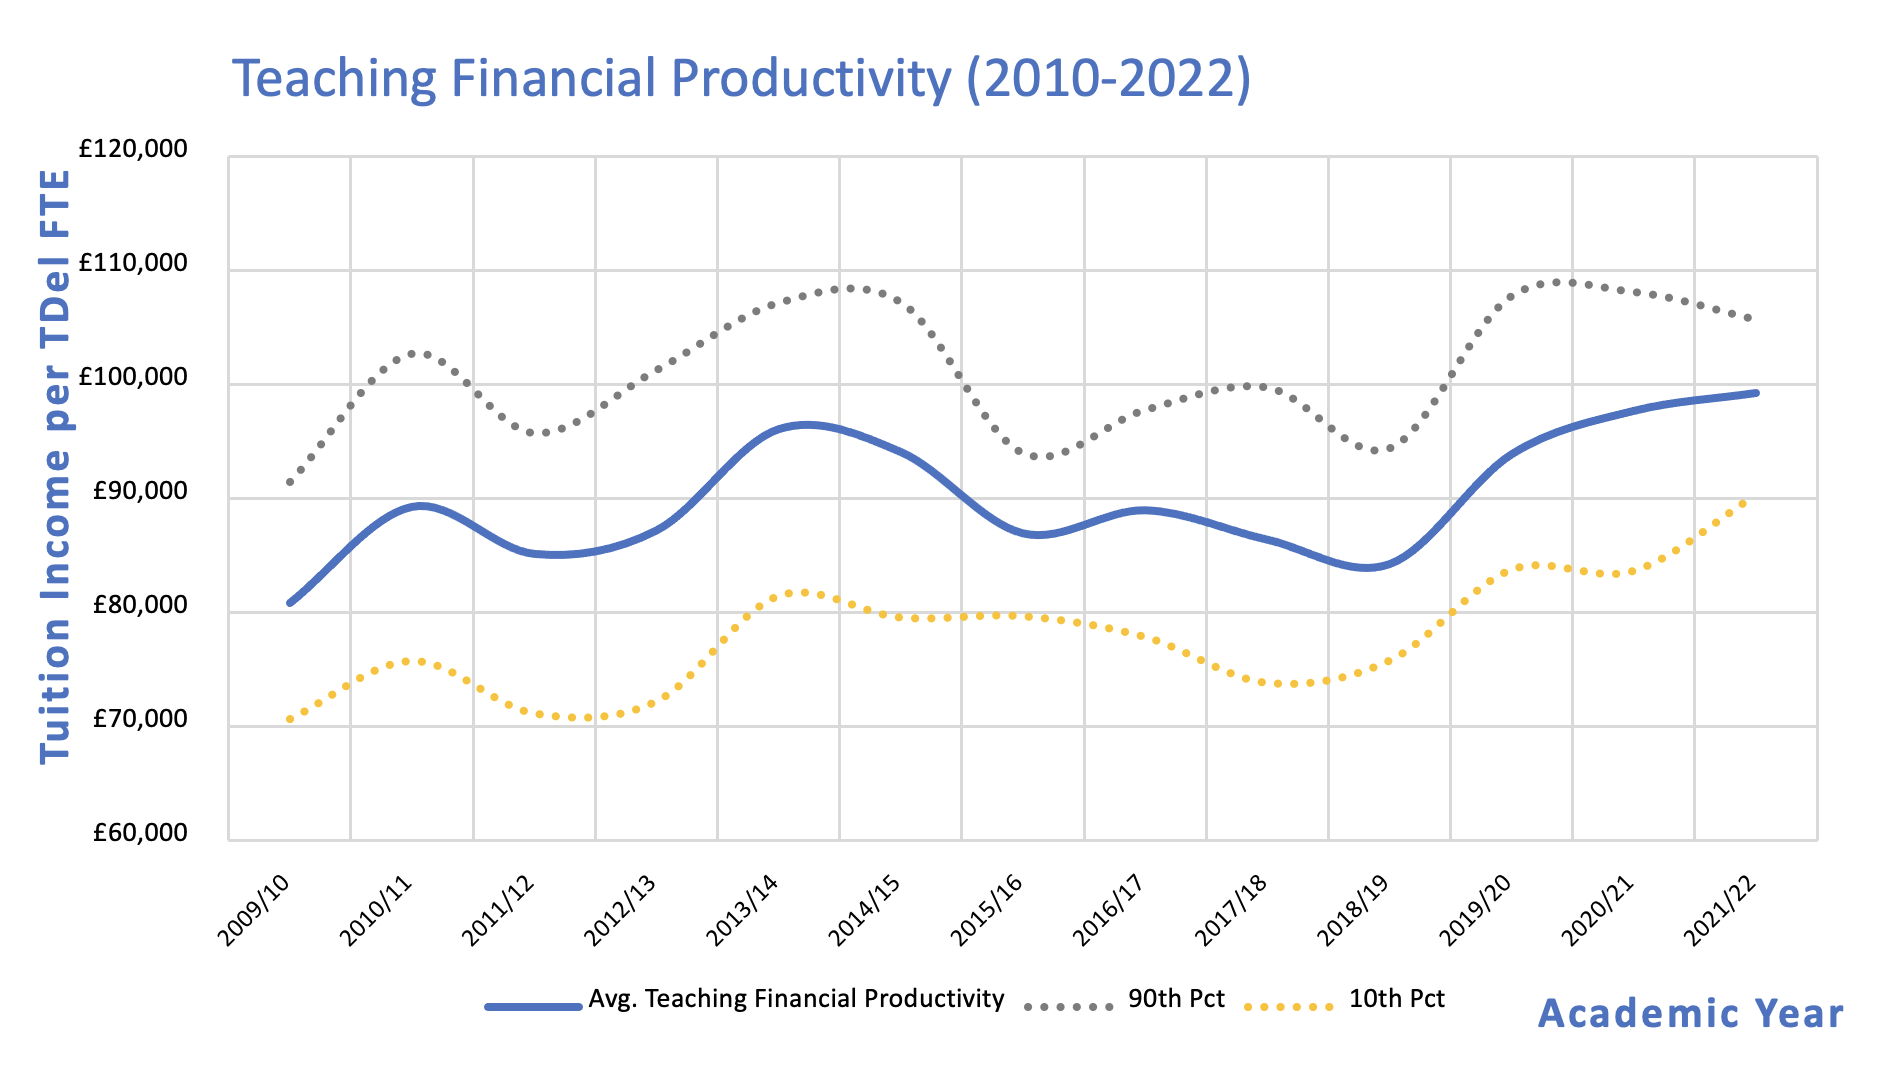
The 21% rise in Teaching Financial Productivity over this period indicates that although external factors will impact this measure, there has been a lot of focus on financial efficiency. It is no surprise given the financial implications of being an outlier at either end of the scale. Since 2010, the average gap between the most and least financially productive was £22,858 per Teaching and Training Delivery FTE. Scaling this up, this reflects a variance in Teaching Financial Productivity of £2.28mil per 100 FTEs.
Does high Teaching Financial Productivity mean cost efficient?
Interestingly however, a high level of Teaching Financial Productivity does not necessarily equate to lower costs.
In fact, evidence indicates there is very little correlation between the two. It is not that unusual to find a college that has a high level of Teaching Financial Productivity, but also has a higher normalised Teaching and Training Delivery cost.
For many colleges, the unveiling of the Teaching Financial Productivity value is gaining access to previously unmeasured insight. For some colleges we conclude “it’s a good job the college has a higher level of Teaching Financial Productivity” as other factors such as geography, delivery mix, average pay levels, or curriculum or learner profile, have significant impact and result in higher Teaching and Training expenditure for the college. In these instances, if it weren’t for the higher level of Teaching Financial Productivity, we would have recorded even greater cost and variance to benchmarks. For other colleges, revealing a lower Teaching Financial Productivity measure provides objective evidence that draws focus to the need for the college to operate more financially efficiently, and can deliver a shortcut to understanding which teaching departments the college needs to focus attention on.

Applying benchmarking outcomes to real-world effects
The real impact of benchmarking is when we begin to draw relationships. How do numbers help colleges better understand the real-world drivers underpinning Teaching Financial Productivity?
We reference three levers available to colleges to influence Teaching Financial Productivity – Funding Efficiency, Class Size Ratio, and Teaching Utilisation. A measure of Funding Efficiency demonstrates how much tuition income is generated by a college per student hour received. This measure is most commonly impacted by course length, although is also affected by funding levels and curriculum profile. We’ve seen a 5% increase in Funding Efficiency since 2010 and the average gap between the highest and lowest levels was £3.67 per student hour – this was a variance of £1,982 per 540 hours. Scale that up to 1,000 Full-Time Equivalent Students and we’re looking at a variance of £1.98mil.
Class Size Ratio and Teaching Utilisation are the other two levers we reference; both providing a benchmarkable number but needing context to understand and quantify what action can be taken. For example, a multi-site profile may lead to course duplication or smaller class sizes, a high volume of High Needs Income can also impact the Class Size Ratio, legacy teaching contracts or a High HE profile can influence Teaching Utilisation; benchmarking helps quantify the impact of these features to inform action or strengthen messaging.
Combining benchmarking with context and objective narrative
If evidence-based decision making is going to sit central to informing strategy across the FE sector, benchmarking must move away from being just a numbers game with a few KPIs tasked at defining financial efficiency in an educational setting. Context and objective narrative are vitally important; an understanding of the underpinning factors that are driving the commonly measured indicators is key to empowering college leaders to be able to help de-risk strategy. Numbers and ratios are vital to draw comparisons, but they must have merit and offer a level of insight that enables action. Without this, benchmarking is just a numbers game.
We're currently making available an extract of our Benchmarking analysis for Further Education in a bid to help colleges better understand how their financial operations stack up against the backdrop of the wider sector.

(If you would like some context to the findings and your college’s benchmark report, please get in touch – we’re more than happy to provide more background for your chosen benchmark area.)
TOPICS:

