Tribal’s benchmarking team have been working with UK colleges for over 25 years. The benchmarking team have also been the chosen provider of sector-wide benchmarking since 2007 for an overseas Government. The team are well-placed to comment on sector trends using the insight from their detailed model and consistent approach.
Tribal have chosen to share some high-level insights into what their benchmarking data has shown over time, providing 3-year rolling averages from 2006-07 up until 2021-22, to offer FE leaders and agencies some indicators that may prove useful whilst also prompting productive dialogue around the value and use of benchmarking.
In this series of articles, Tribal will share insight into each of the benchmarking categories in their model, such as Library, Learner Services, MIS and Registry, IT Services, Marketing, Sales and Business Development, Corporate Services, Estates, and Teaching, giving some granular insight and delivering observations from the projects they have delivered.
Finding insight in the detail, not the headline
Benchmarking is often used as an indicator of performance rather than a more detailed analysis of the factors that may be impacting performance, and more specifically, learner and financial outcomes. A high-level overview can sometimes be quite misleading; headline figures can conceal important messages and omit the necessary detail desired to provide evidence to support or challenge theories and assumptions.
The relationship between pay and income
A pay to income ratio is a metric commonly used to provide an assessment of financial resilience. At Tribal, we have always exercised some caution around this indicator; one reason would be because of the propensity for colleges to outsource the delivery of some services to third-party organisations. The importance of consistent recording and measurement is vital if decisions are to be made from these high-level indicators, and the same consideration needs to be applied when measuring income; it’s vital to be sure comparisons are fair and data recording is consistent. At Tribal, we have that integrity, and our consistent approach allows us to reflect on running trends.
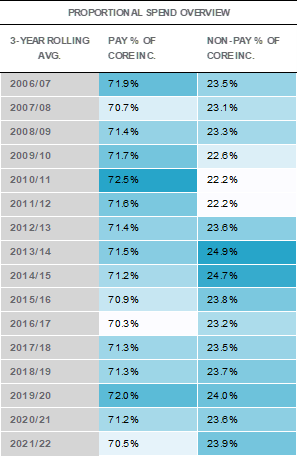
Figure 1 proportional spend on pay and non-pay activity on a three-year rolling average basis.
Our data shows limited movement in overall expenditure since 2006-07, with colleges tending to spend 71.3% of core income on pay, and 23.5% on activity we define as non-pay. Our most recent data highlights that proportional spend on pay has fallen to a similar level to that recorded in 2007-08 and 2016-17, whilst conversely, non-pay activity costs appear to be rising relative to income.
Front-line delivery or business support – where do costs sit?
Another way of looking at proportional spend is to reflect on teaching activity and non-teaching activity.
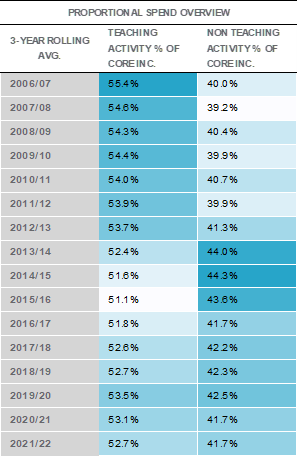
Figure 2 proportional spend on teaching and non-teaching activity on a three-year rolling average basis.
Teaching activity for Tribal includes three sub-headings; Teaching Delivery, Teaching Support, and Teaching Administration; and within here there are 16 pay categories and 7 non-pay categories.
Proportional spend on teaching activity has reduced by 3 points since 2006-07, whilst non-teaching activity spend has increased.
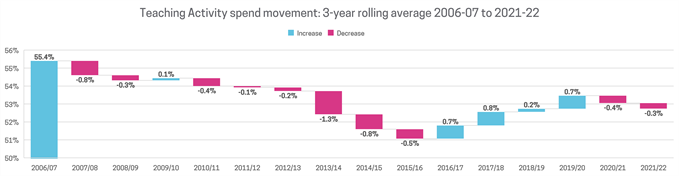
Figure 3 movement in proportional spend on teaching activity on a three-year rolling average basis.
Our data shows that colleges spent £550k on teaching activity in 2006-07, for every £1mil of core income. By 2015-16 this had reduced by £40k per £1mil of core income, which may not seem significant, but for a £40mil college, that would reflect £1.6mil less investment on teaching activity.

A proportional increase in spend on non-teaching activity stopped in 2014-15 when we were likely to record £440k of non-teaching activity cost per £1mil of core income. The general trend since then appears to be that non-teaching activity costs are reducing, although we’re still not at pre-2012-13 levels, and we suspect this downward trend may be difficult to sustain.
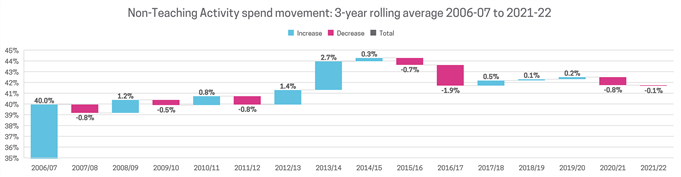
Figure 4 movement in proportional spend on non-teaching activity on a three-year rolling average basis.
Although interesting to see these themes and to highlight some high-level indicators, benchmarking at this level is a relatively blunt tool. However, I often comment that these high-level indicators provide us with the first window into how the college compares; to begin to understand the catalysts behind these high-level indicators, we need to get into the detail and then add the necessary context that moves us away from benchmarking being just a set of numbers.
A shrinking workforce
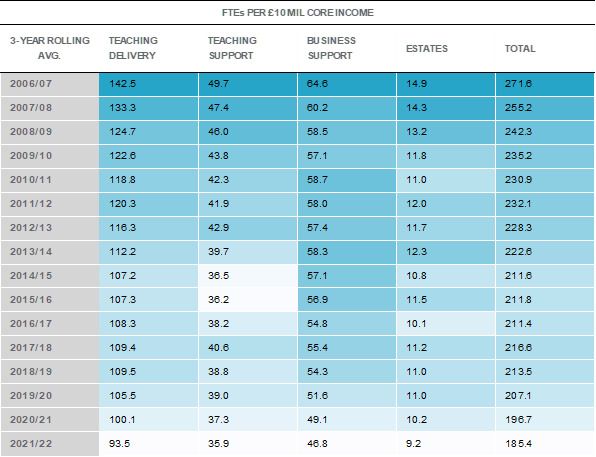
Figure 5 number of staff FTEs used by broad category per £10mil of core income on a three-year rolling average basis.
One theme that could have been predicted was that colleges used fewer FTEs in 2021-22 compared to 2006-07. We recorded that colleges were using 86 fewer FTEs per £10mil of core income. Some of this could be explained by the number of mergers across the sector, but there will certainly be other factors involved. The area with the largest reduction of FTEs was teaching delivery, and although teaching support and business support activity have both also seen reductions in excess of 25% in FTEs relative to income, these activities now have more FTEs as a proportion of total college staff; 45% of college FTEs undertake these activities in 2021-22 compared to 42% in 2006-07.
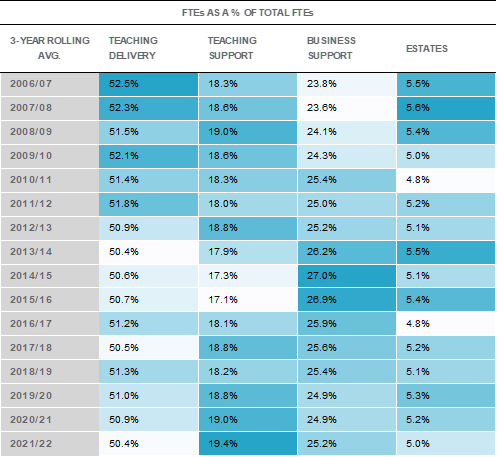
Figure 6 staff FTEs by broad category as a proportion of total college FTEs on a three-year rolling average basis.
The increase in teaching support FTEs as a proportion of total staff highlights that there has been a more significant reduction in teaching delivery FTEs, but it may also indicate that colleges have found it more difficult to find ‘efficiencies’ in providing additional learning support.
Diversification and spreading the risk
To maintain the integrity of comparisons, Tribal’s approach to benchmarking is to isolate some activity because of the inconsistent nature of it. For example, different colleges will have different capitalisation policies and we will see varying volumes of depreciation and debt servicing that could potentially skew outputs and impact comparability. Note, this activity is isolated and looked at separately; it’s not excluded as it plays a significant role in each college’s story.
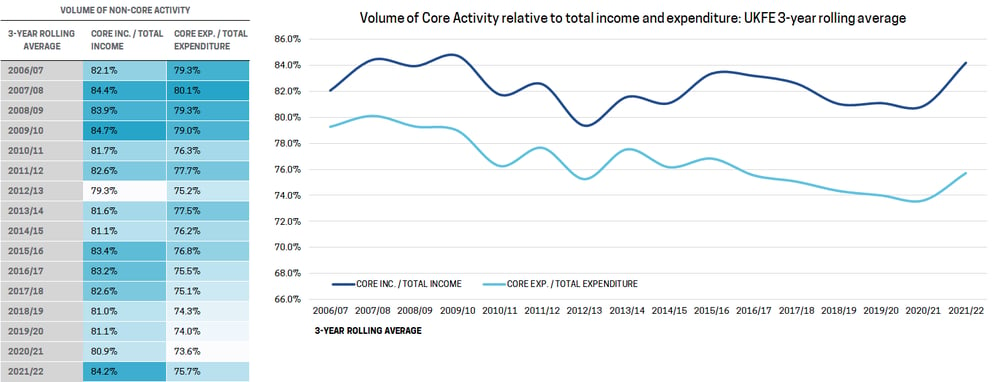
Figure 7 proportion of activity classified as core on a three-year rolling average basis.
Core income as a proportion of total income has fluctuated over time. This in some part will reflect the different colleges that Tribal have worked with, but it is still a fair representation of the sector. At times, colleges have felt it necessary to diversify revenue to supplement core funding; with it comes risk and as leadership and political policies change, so may the strategic direction of the college. For some colleges it is about opportunity – do they have land, buildings, sports facilities, or car parking space that can be let out? Sub-contracted out teaching is a common example of the significant variation in volume and contribution attached to what we’d reference as Associated Activities. Historically, we’ve recorded some colleges sub-contracting out 20% of turnover, which for some provided significant margins but it did raise questions around quality and risk. Changes to sub-contracting rules means this is becoming a more limited opportunity to increase revenue.
Core expenditure as a proportion of total expenditure has fallen by 3.6 points since 2006-07, and the trend in cost appears more consistent than we saw with income. What this might indicate is that college’s non-core spend is growing in terms of level of expenditure; or at least hasn’t been reducing at the same rate as core costs. To look at this another way, our latest data is showing that about 25% of college expenditure is not related to the delivery of teaching or training, and the wrap-around services the college needs to function, and this has grown from 21% in 2006-07.
The impact of non-core activity on a college’s financial sustainability is significant, that’s why we don’t exclude or ignore it, but reflect on it discretely. That said, the question is, how much can college’s control some of this non-core financial burden?
A final thought
This first look at our historical benchmarking data shows that the UKFE sector has been able to act flexibly and react positively to the need to operate more financially efficiently. Some efficiencies will have naturally occurred over time through (some successful) mergers, better data and information, technology, and system improvements etc., but also, colleges have had to, and continue to need to, devise and share methods to strive to deliver the dual mandate of providing learners with the best possible teaching and training, whilst remaining financially sustainable – that’s one thing that has not changed.
Throughout this piece, we’ve aggregated the data, the data analysis for each individual college provides vastly more granularity, and forthcoming articles will provide a deeper dive into different areas. Whilst the headlines afforded by benchmarking will always be of interest, the gold is always found in that granular detail. And those insights are often the catalysts for real change.
See for yourself how we can surface actionable, objective and granular analysis to aid finance strategy at your institution.

NB: Our Benchmarking methodology is now being used in a collaborative model with colleges seeking to identify best practice and better inform financial strategy. This work, in conjunction with the FE Commissioner’s Office, represents a new opportunity for colleges to benefit from independent, sector-wide insight. If you would like to find out more about the project, please contact Phil Moseley directly at phillip.moseley@tribalgroup.com
TOPICS:

