Tribal’s benchmarking team have been working with UK colleges for over 25 years. The benchmarking team have also been the chosen provider of sector-wide benchmarking since 2007 for an overseas Government. The team are well-placed to comment on sector trends using the insight from their detailed model and consistent approach.
Tribal have chosen to share some high-level insights into what their benchmarking data has shown over time, providing 3-year rolling averages from 2006-07 up until 2021-22, to offer FE leaders and agencies some indicators that may prove useful whilst also prompting productive dialogue around the value and use of benchmarking.
In this series of articles, Tribal will share insight into each of the benchmarking categories in their model, such as Library, Learner Services, MIS and Registry, IT Services, Marketing, Sales and Business Development, Corporate Services, Estates, and Teaching, giving some granular insight and delivering observations from the projects they have delivered.
What is the cost of rising exam spend on MIS?
In this article we continue to reflect on our historical benchmarking data, focusing on our MIS/Registry category where we show growing net exam cost is the key driver for an increase in spend in this area. We also highlight the continued importance placed on staff performing student data recording and reporting.
In Tribal’s benchmarking model, MIS/Registry activity includes Operational Management, Student Data Inputting, Administration, and Maintenance, Business Intelligence and Reporting, and Examinations. The model also identifies Discrete Examination Income (e.g., student exam resit charges), and Exam Non-Pay Costs (e.g., registration and validation).
In 2006-07, we recorded that MIS/Registry expenditure was equivalent to 5.1% of total core income; this has risen to 6.9% in our most recent data. Colleges are now spending more on this activity (about £500k more for a £30mil college) than we found in 2006-07.
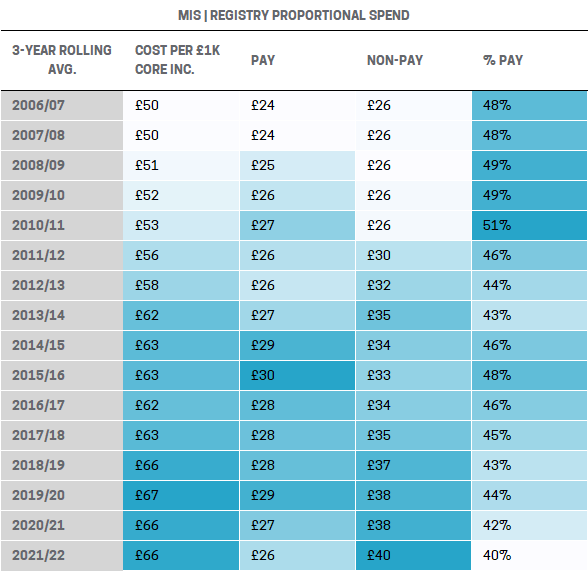 Figure 1 Proportional spend on pay and non-pay activity on a three-year rolling average basis
For every £1k of core income, colleges on average spend £66 on MIS/Registry activity, which equates to £1.98mil for a £30mil college. The increase in cost relative to income is directly caused by an increase in non-pay expenditure, and more specifically, less discretely identifiable exam fee income.
In 2006-07, we recorded that colleges were spending £24 per £1k core income on MIS/Registry pay and colleges were spending broadly the same amount on pay as they were on non-pay in this area. However, in our most recent data, the overall cost profile for MIS/Registry is now weighted towards non-pay.
In 2021-22, we recorded that MIS/Registry non-pay costs had increased from £26 per £1k core income to £40, which represented a 54% increase. During this period, MIS/Registry pay costs increased by 8% from £24 to £26 per £1k core income.
This shift in cost profile has meant that we have seen pay costs reduce from 48% of MIS/Registry total costs in 2006-07, to 40% in 2021-22.
Fewer FTEs, but data recording and reporting still play a vital role
Colleges are now using fewer staff FTEs to deliver MIS/Registry activity. 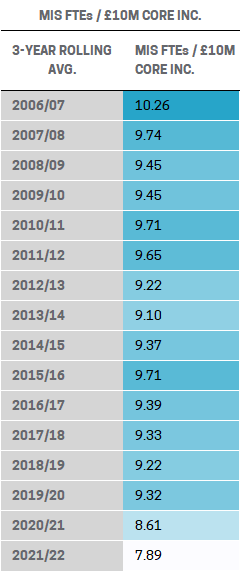
Figure 2 MIS | Registry FTEs used per £10m of core income on a three-year rolling average basis
A reduction in the number of FTEs used may be linked to improved systems and processes that require less manual input but will also reflect the changing FE sector landscape comprising fewer, larger colleges. The changing landscape of FE will have contributed to the reduction in Management FTEs, but another factor will be the introduction of discrete analytical roles undertaking business intelligence, which previously would have sat with the more senior roles in this area.
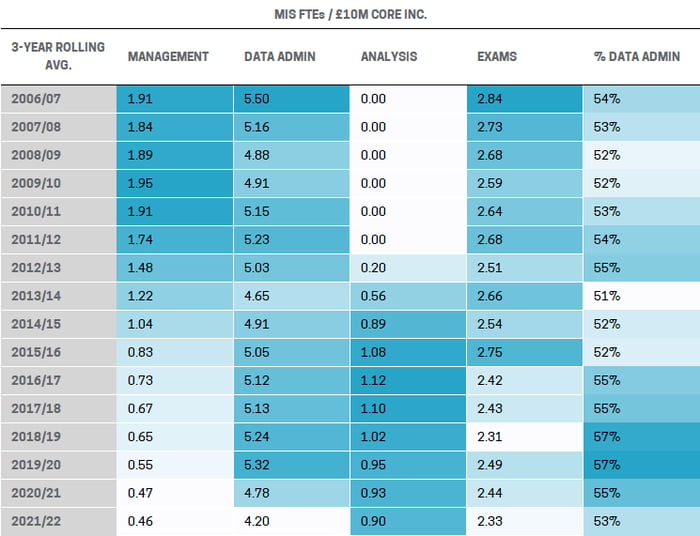
Figure 3 MIS | Registry FTEs by category per £10m of core income on a three-year rolling average basis
As colleges became more adept at performing their own data analysis, we noted a growing propensity for BI Reporting and Analysis roles leading to the discrete capture of the activity in Tribal’s model since 2013. Since then, we have recorded a growth in this category and we now might expect to see a £30mil college have a team of about 3 FTEs undertaking this type of activity, although for smaller colleges, discrete analytical teams continue to sit in the “nice to have” column when balancing a tight budget.
Despite the reduction in MIS/Registry FTEs, we noted that the proportion of roles being recorded as performing Student Data Inputting, Administration, and Maintenance had remained relatively static. In 2006-07, 5.5 FTEs were undertaking this activity per £10mil of core income, which reflected 54% of the total number of MIS/Registry FTEs. In 2021-22, this had reduced to 4.2 FTEs per £10mil of core income and reflected 53% of the total FTEs in this area.
The process of recording learners onto the college’s student management system, and the importance of accurate data recording, is likely to be the principal cause for this pattern. There remains a need to provide accurate statutory data returns to draw down funding, and a need to produce data to aid curriculum and wider strategic planning in college.
The ratio of Student Data Inputting, Administration, and Maintenance and Examinations staff FTEs relative to income has barely altered since 2006-07. Over half of MIS/Registry FTEs look after student data and over a quarter are working in and around examinations. Although colleges have reduced staff FTEs, these ratios haven’t really changed which means there has been limited scope for investing in discrete analytical roles.
Increased exam costs
The impact of improved systems and processes may have been a partial catalyst for the reduction in MIS/Registry staff FTEs, but we also need to consider a rise in non-pay costs and the need for colleges to find efficiencies.
In 2006-07, we found that colleges were spending about £33 on FE Exam non-pay per £1k core income. We saw a spike in FE Exam costs between 2011-12 and 2015-16. which was followed by a reduction in spend back towards £32 per £1k core income in 2016-17.
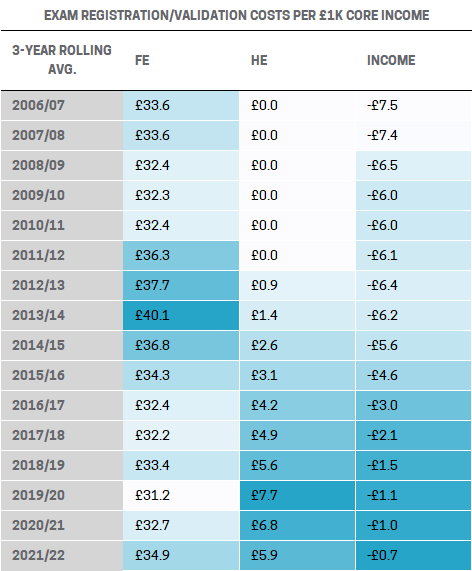
Figure 4 spend on exam non-pay activity on a three-year rolling average basis
In our latest data we have seen evidence of the beginning of a similar spike, albeit noting that the recent rise in exam costs may cause this to become a more sustained increase. The 2021-22 three-year rolling average has increased to nearly £35 per £1k core income, but the in-year results show an even starker increase.
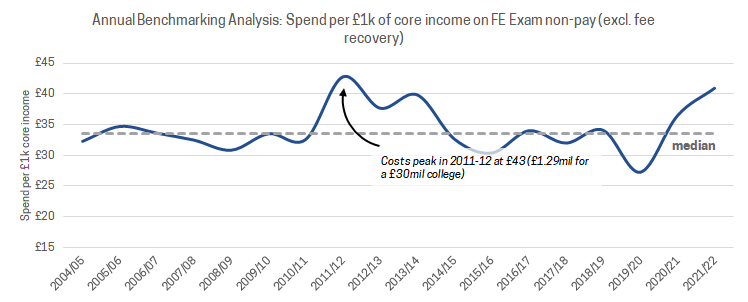
Figure 5 in-year spend on FE exam non-pay costs per £1k core income
Colleges provide access to learning and training for many, and as part of that arrangement, those learners need to be assessed. There is no obvious solution to the cost increase for colleges and therefore this rise has had to be offset with reductions elsewhere.
We should also reflect on HE exam expenditure, which the Tribal model began to discretely identify about a decade ago and includes the validation fees paid to universities and the OFS fee. The volume of HE in FE varies between colleges but an interesting observation may be the recent reduction in HE exam costs in those colleges we have worked with. We may speculate that the cost of delivering HE in FE is becoming increasingly more prohibitive for colleges to deliver, particularly for those that don’t have significant volume, which may be a primary cause for this reduction.
Fee recovery - how easy is it?
Historically we have seen that colleges have been able to recover some exam cost in the form of fees. Over time we have seen little consistency with protocol, with some colleges applying a strict recharge rule, others offering a “free go” or two, and others being even more lenient. I’ve seen the point made in at least one college that if “the student doesn’t turn up for the exam, the college still bears the cost”.
In 2006-07, we were recording £7.50 of recovered exam costs per £1k core income, but in our latest data this is now less than £1. Over time we have seen colleges alter common practices - with exam fees less likely to be discretely identifiable, and more likely to be incorporated into a student's tuition fee; a key reason for the downturn in recorded income being recovered.

A final thought
As colleges have wrestled with austerity and the growing necessity to reduce costs, leadership teams have had to balance this with the need to maintain key systems and address the challenges of a post-Area Review landscape. We should also note the value of MIS/Registry teams in keeping on top of funding changes, funding conditions, and providing the regulatory data returns that contribute to future funding allocations… and there is little evidence that any of this will change.
What we can say with some confidence is that, relative to income, staff numbers in MIS/Registry teams have shrunk over time. Any financial efficiency gained via a reduction in staff FTEs has been offset by inflationary increases in staff costs, so colleges in 2022 were still spending about the same amount on pay as they were in 2006-07 for the same volume of core income.
The biggest challenge to colleges in this area is the rising cost of exams. Our data reflects what has been widely reported; exam costs have increased, and are increasing still, and relative to income, the cost to colleges has risen significantly.
The exam cost increase has added to the budgetary pressure caused by austerity and further limits flexibility, resulting in colleges having to continue to spend carefully on activities that impact enrolment, funding, and assessment.
Benchmarking data has helped colleges identify evidence of best practice in terms of streamlining student data entry and management processes, improving financial efficiency and effectiveness, and highlighting in some cases a need to review exam practices.
Because data quality is so important to compliance and funding however, colleges cannot risk losing resource that ensures accurate reporting, and accurate and timely reporting is in growing demand to help shape college strategy. Data compliance, analytical insight, and funding maximisation are arguably features that colleges ought to be investing in; but we have seen in our reporting that this hasn’t been the case… and rising exam costs may hinder this further.

NB: Our Benchmarking methodology is now being used in a collaborative model with colleges seeking to identify best practice and better inform financial strategy. This work, in conjunction with the FE Commissioner’s Office, represents a new opportunity for colleges to benefit from independent, sector-wide insight. If you would like to find out more about the project, please contact Phil Moseley directly at phillip.moseley@tribalgroup.com
TOPICS:

