Tribal’s benchmarking team have been working with UK colleges for over 25 years. The benchmarking team have also been the chosen provider of sector-wide benchmarking since 2007 for an overseas Government. The team are well-placed to comment on sector trends using the insight from their detailed model and consistent approach.
Tribal have chosen to share some high-level insights into what their benchmarking data has shown over time, providing 3-year rolling averages from 2006-07 up until 2021-22, to offer FE leaders and agencies some indicators that may prove useful whilst also prompting productive dialogue around the value and use of benchmarking.
In this series of articles, Tribal will share insight into each of the benchmarking categories in their model, such as Library, Learner Services, MIS and Registry, IT Services, Marketing, Sales and Business Development, Corporate Services, Estates, and Teaching, giving some granular insight and delivering observations from the projects they have delivered.
Reducing Corporate Services expenditure, through design or necessity?
In this article we draw focus on Corporate Services activity, and how the cost profile of this area has altered since 2006-07.
Corporate Services is the fourth largest area of expenditure in Tribal’s model. Under the banner of Corporate Services, we include key operational activity such as Executive Leadership, Finance, Quality and Improvement, and HR. It also includes on average 17% of a college’s total non-pay spend; on things such as Printing, Postage, and Stationery, Travel, Staff Training, Recruitment, Auditing, Furniture and Equipment, and Professional Fees.
In 2006-07, Corporate Services expenditure was equivalent to 12.5% of total core costs; this has now reduced to 10.3%, and the type of spend within Corporate Services is now more heavily weighted towards pay costs, which now account for almost two thirds of the expenditure in this area.
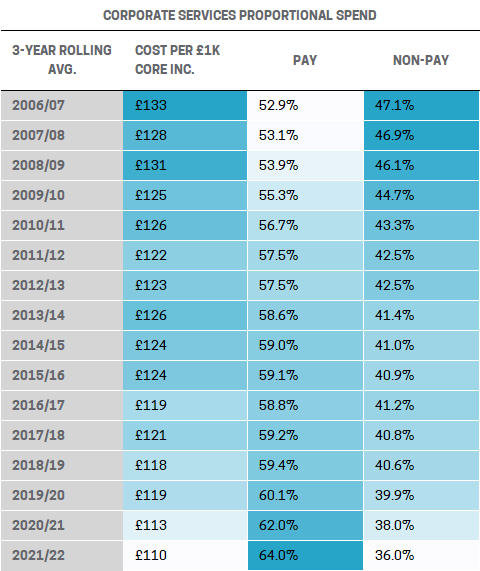
Figure 1 proportional spend on pay and non-pay activity on a three-year rolling average basis
This observation sits squarely with our anecdotal evidence over the years; when colleges have needed to quickly identify cost savings, the Corporate Services non-pay expenditure profile (stationery, printing etc as highlighted in Figure 1) is commonly one of the first areas that is reviewed.
Tightening of the non-pay budget
In 2006-07, Corporate Services non-pay costs were equivalent to over a quarter of colleges’ total non-pay expenditure. This figure now stands at 17%, highlighting that colleges have actively been reducing Corporate Services non-pay expenditure over the years.
We found that colleges are now likely to spend c.£200k less per £10mil of core income on Corporate Services non-pay activity than in 2006-07.
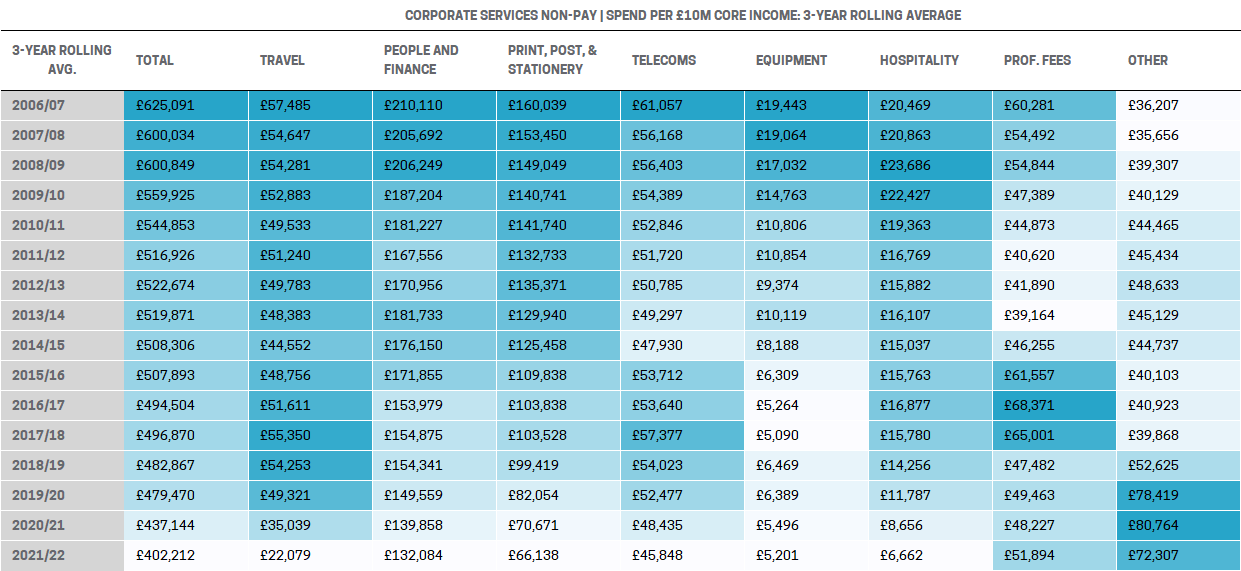
Figure 2 Corporate Services non-pay spend per £10mil of core income on a three-year rolling average basis
The most significant non-pay reduction we recorded related to Print, Postage, and Stationery. A 59% reduction in cost for this activity reflected a reduction of £94k per £10mil of core income, and likely represents the greater digitisation of information recording and sharing, and the growing awareness of climate impact, although we are still noting significant expenditure in our most recent projects attached to third-party photocopying and printing agreements. Another factor to consider is that this is an activity that commonly attracts less challenge than others when reducing costs.
We saw an expected reduction in Staff Travel and Subsistence expenditure during the Covid-19 pandemic, but we were already seeing some examples of colleges harnessing web-based applications for meetings, particularly in colleges which had a multi-site profile, prior to this major event, and it’ll be no surprise that we’ve seen an increase in IT Services expenditure over this period – more on that another time.
Spend on activity that we’ve grouped as People and Finance has reduced by £78k per £10mil of core income (37%). The main causes for a reduction of spend in this area were Staff Recruitment and Advertising (£44k reduction per £10mil of core income) and Staff Training and Development (£20k reduction).
Although not financially significant, we thought it was interesting to note that External Audit Fees have remained static relative to income, but colleges have reduced Internal Audit Fees by about 50% since 2006-07.
The increase in ‘Other’ Corporate Services non-pay expenditure was attributable to a rise in costs categorised as subscriptions and mock inspections.
Inflationary pressures and balancing pay expenditure
We recorded limited movement in Corporate Services total pay costs relative to income, which emphasised that the reduction of cost in this area, and the changing expenditure profile, was due to a reduction in non-pay spend.
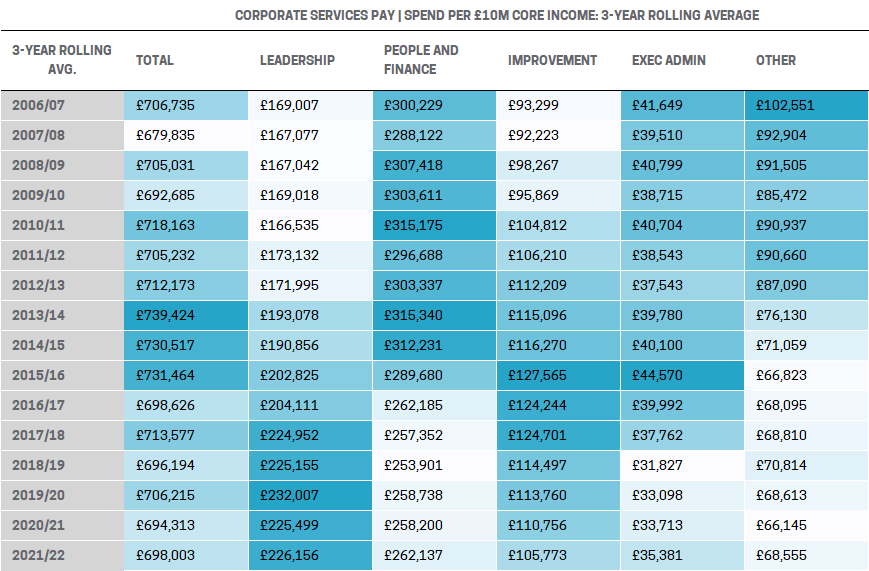
Figure 3 Corporate Services pay spend per £10mil of core income on a three-year rolling average basis
Notable increases in expenditure were recorded in both Leadership and Improvement activities. Greater investment in Improvement could anecdotally be linked to the level of scrutiny colleges face, and the importance of inspection results, and student and financial outcomes.
Investing in (fewer) Leaders
Leadership is how we classify Governance, and Executive and Strategic Management roles, and we noted a 34% increase in costs for this activity since 2006-07. Some of this increase is due to a rise, and more easily identifiable, spend on Governance.
Interestingly, despite the increase in the cost of Leadership, the number of FTEs performing these roles has reduced relative to income. I think it’s important to be mindful that the FE landscape, the number of colleges, and the size and complexity of organisations has altered significantly since 2006-07, and this is important context, but a simple observation is that executive leadership roles are responsible for bigger and, in some ways, more complex organisations than in 2006-07 and are being remunerated more highly. The structure of many colleges’ management teams is now quite different to, say, 15 years ago. This reflects colleges reshaping their executive leadership teams to ensure they are fit to lead larger organisations, which have often been formed by multiple college mergers.
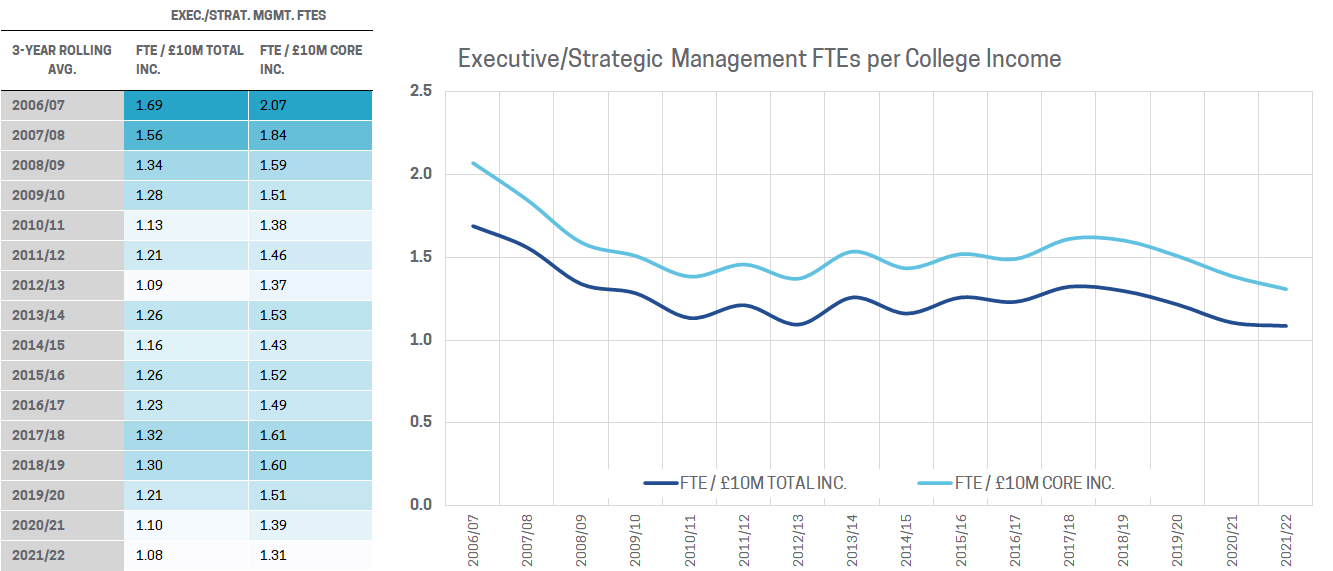
Figure 4 number of Executive and Strategic Management FTEs relative to income measured on a three-year rolling average basis
People and Finance: reducing resources
Rising costs in some cases are inevitable due to inflationary pressures, and in our first blog, Finding financial insight in the detail, not the headline, we’ve shown evidence of colleges mitigating for this from a pay perspective by reducing staff FTEs.
In 2021-22 we found that colleges used 9 fewer FTEs in this area per £10mil of core income, primarily due to a reduction in HR and Finance roles. We noted that the ratio of college staff to HR staff FTEs had more than doubled and colleges’ investment in Staff Training and Development had reduced with only 0.3 FTEs allocated to this activity per £10mil of core income, falling from 1.2 FTEs in 2006-07.
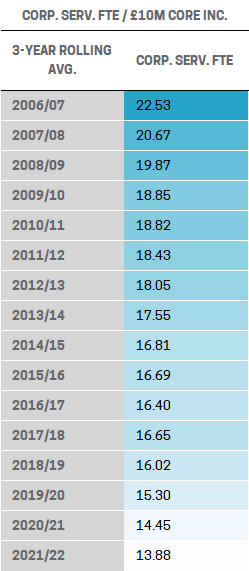
Figure 5 number of Corporate Services FTEs relative to income measured on a three-year rolling average basis
In fact, colleges’ total spend on Staff Training and Development has fallen by £219 per staff FTE since 2006-07, with the most significant reduction appearing in 2016-17. The huge drop in 3-year average spend is sudden and sharp and we might speculate that this was another impact of the financial squeeze colleges faced, and in particular the significant reduction to the Adult Education Budget.
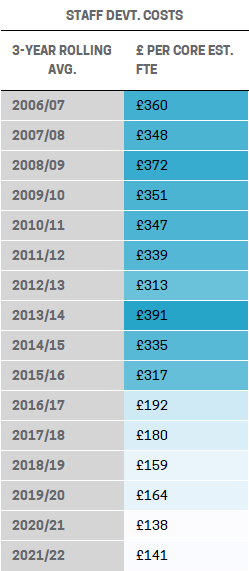
Figure 6 Staff Development costs per established staff FTE measured on a three-year rolling average basis
A final thought
We’ve seen plenty of evidence over the years of Corporate Services being targeted for savings. In some cases, greater financial efficiency has been sought through design, and was likely inevitable as ways of working changed; Postage, Printing, and Stationery and Staff Travel are examples of this. In other cases, changes to the cost profile may have been a result of circumstances, such as the reduction in Staff Training and Development costs, or the number of Corporate Services FTEs used.
What may, in some cases, appear to be relatively small reductions to the cost profile when we look at changes on a ratio basis, are actually quite significant. For a £40mil college, the reduction in Staff Training and Development would reflect £162k less investment; the reduced spending on Staff Recruitment would be a £176k saving; we’d be talking about a £376k reduction in Postage, Printing, and Stationery costs, or a c.£1.26mil lower pay expenditure due to using fewer staff FTEs.
I think the reality of the situation with Corporate Services is that it demonstrates how agile colleges have had to be. A squeeze on funding, inflationary pressures on pay, and a global pandemic are challenges that colleges have faced. In our experience, it’s common for colleges to try and avoid looking at Teaching and Training too quickly when it comes to finding the financial efficiencies needed to react to those challenges, so support services tend to be looked at first, and given the composition of Corporate Services, some elements of this area are right at the top of the list. The critical question we’re often asked though is, “How lean can you be before you start affecting service quality?”. The answer to this question is never straightforward, and unfortunately isn’t necessarily consistent. For some colleges, staff experience, or organisational structure, profile, and processes allows for a leaner operation. Student, curriculum, and geographical profile will also impact how colleges are able to manage the same activity. What benchmarking has enabled colleges to do is have an informed debate around which word is the right word to describe some results; lean, or under-resourced?
See for yourself how we can surface actionable, objective and granular analysis to aid finance strategy at your institution.
NB: Our Benchmarking methodology is now being used in a collaborative model with colleges seeking to identify best practice and better inform financial strategy. This work, in conjunction with the FE Commissioner’s Office, represents a new opportunity for colleges to benefit from independent, sector-wide insight. If you would like to find out more about the project, please contact Phil Moseley directly at phillip.moseley@tribalgroup.com
TOPICS:
SHARE THIS ARTICLE:


